ASTA is a spectral analysis software for displaying, fitting and analyzing astronomical spectra emission and absorption line spectra. The software is based on the GR theoretical model produced by the Astrophysical Spectroscopy Team of the National and Kapodistrian University of Athens.
ASTA is able to fit, process and analyze:
- Simple spectral lines that can be simulated by a classic distribution such as Gauss, Lorentz or Voigt. In these cases, ASTA has the ability to calculate the line function of an observed spectral line and calculate the physical parameters of the region that produces the spectral line. ASTA also incorporates two new mathematical distributions formulated by the Astrophysical Spectroscopy Team of the National and Kapodistrian University of Athens. These distributions are called Rotation (Danezis et al., 2007, Lyratzi et al., 2007) and Gauss-Rotation (Danezis et al., 2007, Lyratzi et al., 2007). Rotation distribution is used in the case the region that produces a spectral line rotates around its own centre. Accordingly, Gauss-Rotation distribution is used in the case that the region producing a spectral line is characterized by both random motions and rotation.
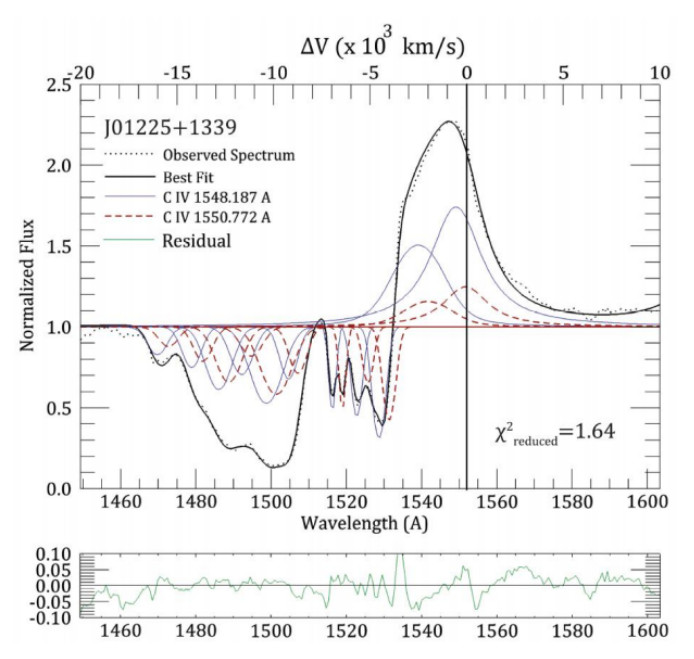
- Spectral lines that exhibit complex and asymmetric profiles and as a consequence are the product of the synthesis (blend) of individual components of the same ion. Characteristic examples of this case are the Broad Absorption Lines (BALs) and Broad Emission Lines (BELs) found in the spectra of Quasars, mthe Discrete Absorption Components (DACs) and Satellite Absorption Components (SACs) seen in the spectra of Hot Stars and Hot Emission Stars. Other astronomical objects exhibiting complex profiles are Wolf Rayet stars, Cataclysmic Variable stars and Super Novae. In the case of complex and asymmetric spectral lines, such as the ones mentioned, ASTA can provide the analysis of the complex profiles to the uniquely determined individual components it consists of. As a result, ASTA can calculate the physical parameters describing each, uniquely determined, individual component.
- In the case of broad and complex spectral line profiles, ASTA does not provide only the multicomponent analysis of the profiles. It also provides the interpolation polynomial that can simulate (fit) pretty accurately the complex spectral profiles which consist of individual components (see Figure 1).